Chart elements
Streamlit supports several different charting libraries, and our goal is to
continually add support for more. Right now, the most basic library in our
arsenal is Matplotlib. Then there are also
interactive charting libraries like Vega
Lite (2D charts) and
deck.gl (maps and 3D charts). And
finally we also provide a few chart types that are "native" to Streamlit,
like st.line_chart and st.area_chart.
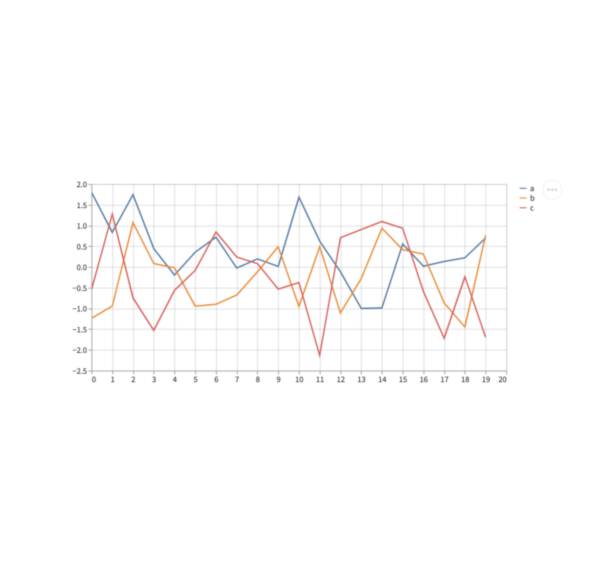
Simple line charts
Display a line chart.
st.line_chart(my_data_frame)
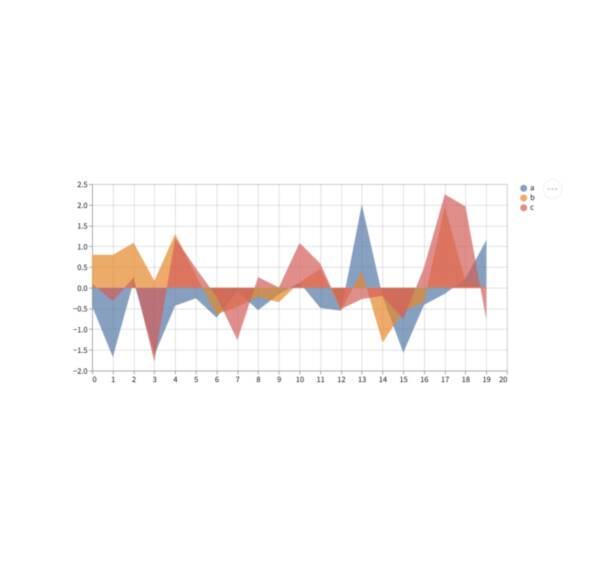
Simple area charts
Display an area chart.
st.area_chart(my_data_frame)
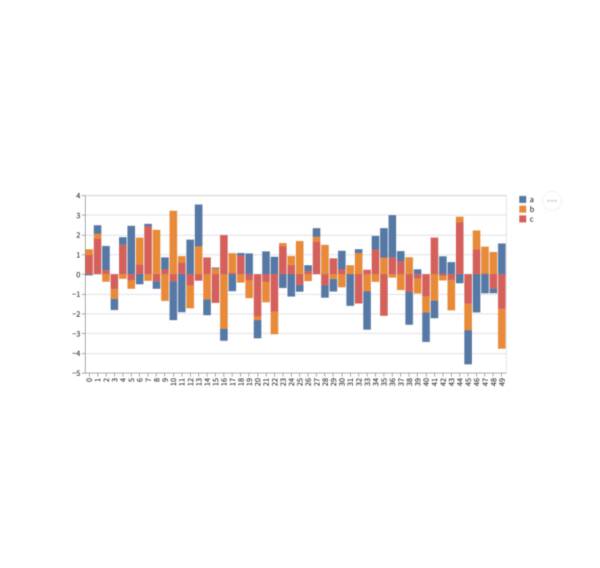
Simple bar charts
Display a bar chart.
st.bar_chart(my_data_frame)
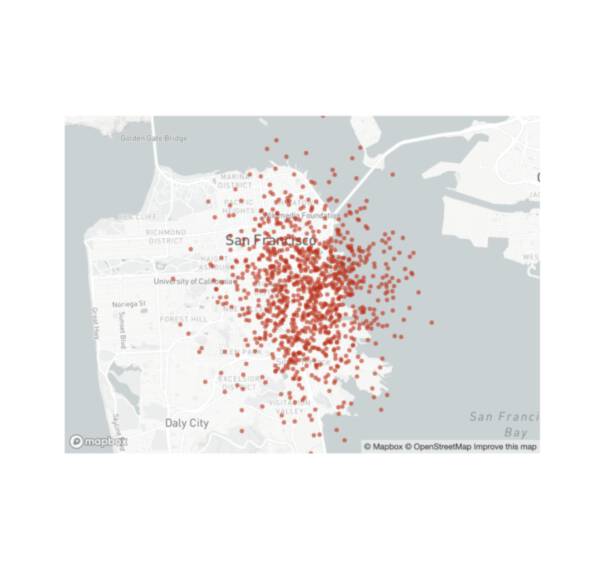
Scatterplots on maps
Display a map with points on it.
st.map(my_data_frame)
Matplotlib
Display a matplotlib.pyplot figure.
st.pyplot(my_mpl_figure)
Altair
Display a chart using the Altair library.
st.altair_chart(my_altair_chart)
Vega-Lite
Display a chart using the Vega-Lite library.
st.vega_lite_chart(my_vega_lite_chart)
Plotly
Display an interactive Plotly chart.
st.plotly_chart(my_plotly_chart)
Bokeh
Display an interactive Bokeh chart.
st.bokeh_chart(my_bokeh_chart)
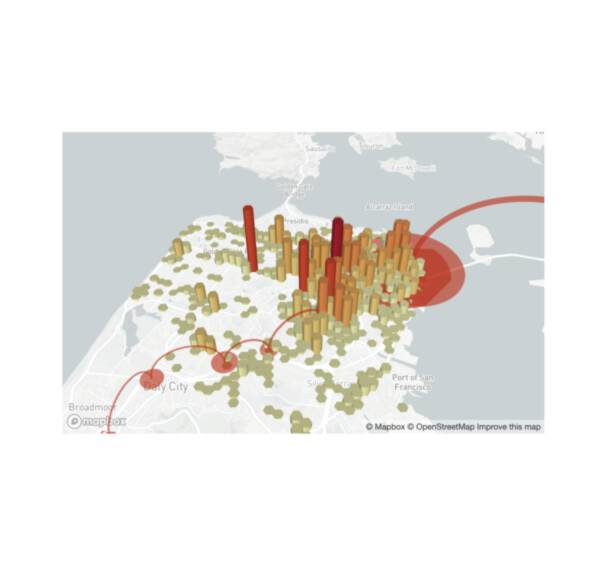
PyDeck
Display a chart using the PyDeck library.
st.pydeck_chart(my_pydeck_chart)
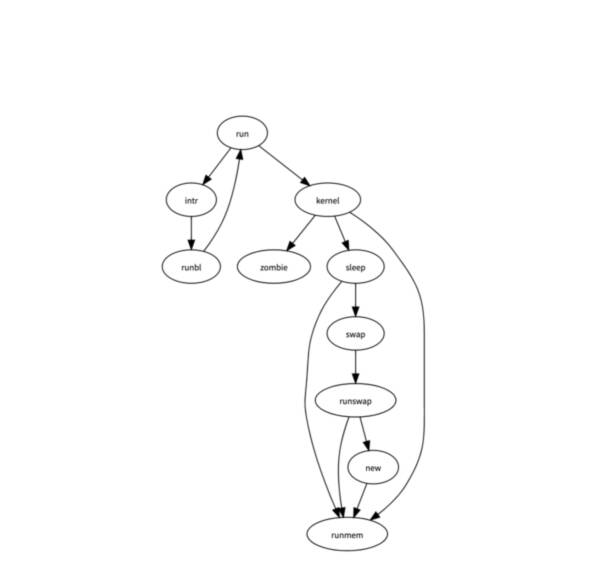
GraphViz
Display a graph using the dagre-d3 library.
st.graphviz_chart(my_graphviz_spec)