Main concepts
Working with Streamlit is simple. First you sprinkle a few Streamlit commands
into a normal Python script, then you run it with streamlit run:
streamlit run your_script.py [-- script args]
As soon as you run the script as shown above, a local Streamlit server will spin up and your app will open in a new tab in your default web browser. The app is your canvas, where you'll draw charts, text, widgets, tables, and more.
What gets drawn in the app is up to you. For example
st.text writes raw text to your app, and
st.line_chart draws — you guessed it — a
line chart. Refer to our API documentation to see all commands that
are available to you.
Note
When passing your script some custom arguments, they must be passed after two dashes. Otherwise the arguments get interpreted as arguments to Streamlit itself.
Another way of running Streamlit is to run it as a Python module. This can be useful when configuring an IDE like PyCharm to work with Streamlit:
# Running
$ python -m streamlit your_script.py

# is equivalent to:
$ streamlit run your_script.py
Tip
You can also pass a URL to streamlit run! This is great when combined with
Github Gists. For example:
$ streamlit run https://raw.githubusercontent.com/streamlit/demo-uber-nyc-pickups/master/streamlit_app.py
Development flow
Every time you want to update your app, save the source file. When you do that, Streamlit detects if there is a change and asks you whether you want to rerun your app. Choose "Always rerun" at the top-right of your screen to automatically update your app every time you change its source code.
This allows you to work in a fast interactive loop: you type some code, save it, try it out live, then type some more code, save it, try it out, and so on until you're happy with the results. This tight loop between coding and viewing results live is one of the ways Streamlit makes your life easier.
Tip
While developing a Streamlit app, it's recommended to lay out your editor and browser windows side by side, so the code and the app can be seen at the same time. Give it a try!
Data flow
Streamlit's architecture allows you to write apps the same way you write plain Python scripts. To unlock this, Streamlit apps have a unique data flow: any time something must be updated on the screen, Streamlit reruns your entire Python script from top to bottom.
This can happen in two situations:
Whenever you modify your app's source code.
Whenever a user interacts with widgets in the app. For example, when dragging a slider, entering text in an input box, or clicking a button.
Whenever a callback is passed to a widget via the on_change (or on_click) parameter, the callback will always run before the rest of your script. For details on the Callbacks API, please refer to our Session State API Reference Guide.
And to make all of this fast and seamless, Streamlit does some heavy lifting
for you behind the scenes. A big player in this story is the
@st.cache decorator, which allows developers to skip certain
costly computations when their apps rerun. We'll cover caching later in this
page.
Display and style data
There are a few ways to display data (tables, arrays, data frames) in Streamlit
apps. Below, you will be introduced to magic
and st.write(), which can be used to write
anything from text to tables. After that, let's take a look at methods designed
specifically for visualizing data.
Use magic
You can also write to your app without calling any Streamlit methods.
Streamlit supports "magic commands," which means you don't have to use
st.write() at all! To see this in action try this snippet:
"""
# My first app
Here's our first attempt at using data to create a table:
"""

import streamlit as st
import pandas as pd
df = pd.DataFrame({
  'first column': [1, 2, 3, 4],
  'second column': [10, 20, 30, 40]
})

df
Any time that Streamlit sees a variable or a literal
value on its own line, it automatically writes that to your app using
st.write(). For more information, refer to the
documentation on magic commands.
Write a data frame
Along with magic commands,
st.write() is Streamlit's "Swiss Army knife". You
can pass almost anything to st.write():
text, data, Matplotlib figures, Altair charts, and more. Don't worry, Streamlit
will figure it out and render things the right way.
import streamlit as st
import pandas as pd

st.write("Here's our first attempt at using data to create a table:")
st.write(pd.DataFrame({
    'first column': [1, 2, 3, 4],
    'second column': [10, 20, 30, 40]
}))
There are other data specific functions like
st.dataframe() and
st.table() that you can also use for displaying
data. Let's understand when to use these features and how to add colors and styling to your data frames.
You might be asking yourself, "why wouldn't I always use st.write()?" There are
a few reasons:
- Magic and
st.write()inspect the type of data that you've passed in, and then decide how to best render it in the app. Sometimes you want to draw it another way. For example, instead of drawing a dataframe as an interactive table, you may want to draw it as a static table by usingst.table(df). - The second reason is that other methods return an object that can be used and modified, either by adding data to it or replacing it.
- Finally, if you use a more specific Streamlit method you can pass additional arguments to customize its behavior.
For example, let's create a data frame and change its formatting with a Pandas
Styler object. In this example, you'll use Numpy to generate a random sample,
and the st.dataframe() method to draw an
interactive table.
Note
This example uses Numpy to generate a random sample, but you can use Pandas DataFrames, Numpy arrays, or plain Python arrays.
import streamlit as st
import numpy as np

dataframe = np.random.randn(10, 20)
st.dataframe(dataframe)
Let's expand on the first example using the Pandas Styler object to highlight
some elements in the interactive table.
import streamlit as st
import numpy as np
import pandas as pd

dataframe = pd.DataFrame(
    np.random.randn(10, 20),
    columns=('col %d' % i for i in range(20)))

st.dataframe(dataframe.style.highlight_max(axis=0))
Streamlit also has a method for static table generation:
st.table().
import streamlit as st
import numpy as np
import pandas as pd

dataframe = pd.DataFrame(
    np.random.randn(10, 20),
    columns=('col %d' % i for i in range(20)))
st.table(dataframe)
Draw charts and maps
Streamlit supports several popular data charting libraries like Matplotlib, Altair, deck.gl, and more. In this section, you'll add a bar chart, line chart, and a map to your app.
Draw a line chart
You can easily add a line chart to your app with
st.line_chart(). We'll generate a random
sample using Numpy and then chart it.
import streamlit as st
import numpy as np
import pandas as pd

chart_data = pd.DataFrame(
     np.random.randn(20, 3),
     columns=['a', 'b', 'c'])

st.line_chart(chart_data)
Plot a map
With st.map() you can display data points on a map.
Let's use Numpy to generate some sample data and plot it on a map of
San Francisco.
import streamlit as st
import numpy as np
import pandas as pd

map_data = pd.DataFrame(
    np.random.randn(1000, 2) / [50, 50] + [37.76, -122.4],
    columns=['lat', 'lon'])

st.map(map_data)
Widgets
When you've got the data or model into the state that you want to explore, you
can add in widgets like st.slider(),
st.button() or
st.selectbox(). It's really straightforward
— treat widgets as variables:
import streamlit as st
x = st.slider('x')  # 👈 this is a widget
st.write(x, 'squared is', x * x)
On first run, the app above should output the text "0 squared is 0". Then every time a user interacts with a widget, Streamlit simply reruns your script from top to bottom, assigning the current state of the widget to your variable in the process.
For example, if the user moves the slider to position 10, Streamlit will
rerun the code above and set x to 10 accordingly. So now you should see the
text "10 squared is 100".
Widgets can also be accessed by key, if you choose to specify a string to use as the unique key for the widget:
import streamlit as st
st.text_input("Your name", key="name")

# You can access the value at any point with:
st.session_state.name
Every widget with a key is automatically added to Session State. For more information about Session State, its association with widget state, and its limitations, see Session State API Reference Guide.
Use checkboxes to show/hide data
One use case for checkboxes is to hide or show a specific chart or section in
an app. st.checkbox() takes a single argument,
which is the widget label. In this sample, the checkbox is used to toggle a
conditional statement.
import streamlit as st
import numpy as np
import pandas as pd

if st.checkbox('Show dataframe'):
    chart_data = pd.DataFrame(
       np.random.randn(20, 3),
       columns=['a', 'b', 'c'])

    chart_data
Use a selectbox for options
Use st.selectbox to choose from a series. You
can write in the options you want, or pass through an array or data frame
column.
Let's use the df data frame we created earlier.
import streamlit as st
import pandas as pd

df = pd.DataFrame({
    'first column': [1, 2, 3, 4],
    'second column': [10, 20, 30, 40]
    })

option = st.selectbox(
    'Which number do you like best?',
     df['first column'])

'You selected: ', option
Layout
Streamlit makes it easy to organize your widgets in a left panel sidebar with
st.sidebar. Each element that's passed to
st.sidebar is pinned to the left, allowing
users to focus on the content in your app while still having access to UI
controls.
For example, if you want to add a selectbox and a slider to a sidebar,
use st.sidebar.slider and st.sidebar.selectbox instead of st.slider and
st.selectbox:
import streamlit as st

# Add a selectbox to the sidebar:
add_selectbox = st.sidebar.selectbox(
    'How would you like to be contacted?',
    ('Email', 'Home phone', 'Mobile phone')
)

# Add a slider to the sidebar:
add_slider = st.sidebar.slider(
    'Select a range of values',
    0.0, 100.0, (25.0, 75.0)
)
Beyond the sidebar, Streamlit offers several other ways to control the layout
of your app. st.columns lets you place widgets side-by-side, and
st.expander lets you conserve space by hiding away large content.
import streamlit as st

left_column, right_column = st.columns(2)
# You can use a column just like st.sidebar:
left_column.button('Press me!')

# Or even better, call Streamlit functions inside a "with" block:
with right_column:
    chosen = st.radio(
        'Sorting hat',
        ("Gryffindor", "Ravenclaw", "Hufflepuff", "Slytherin"))
    st.write(f"You are in {chosen} house!")
Note
st.echo and st.spinner are not currently supported inside the sidebar
or layout options. Rest assured, though, we're currently working on adding support for those too!
Show progress
When adding long running computations to an app, you can use
st.progress() to display status in real time.
First, let's import time. We're going to use the time.sleep() method to
simulate a long running computation:
import time
Now, let's create a progress bar:
import streamlit as st
import time

'Starting a long computation...'

# Add a placeholder
latest_iteration = st.empty()
bar = st.progress(0)

for i in range(100):
  # Update the progress bar with each iteration.
  latest_iteration.text(f'Iteration {i+1}')
  bar.progress(i + 1)
  time.sleep(0.1)

'...and now we\'re done!'
Themes
Streamlit supports Light and Dark themes out of the box. Streamlit will first check if the user viewing an app has a Light or Dark mode preference set by their operating system and browser. If so, then that preference will be used. Otherwise, the Light theme is applied by default.
You can also change the active theme from "☰" → "Settings".
Want to add your own theme to an app? The "Settings" menu has a theme editor accessible by clicking on "Edit active theme". You can use this editor to try out different colors and see your app update live.
When you're happy with your work, themes can be saved by
setting config options
in the [theme] config section. After you've defined a theme for your app, it
will appear as "Custom Theme" in the theme selector and will be applied by
default instead of the included Light and Dark themes.
More information about the options available when defining a theme can be found in the theme option documentation.
Note
The theme editor menu is available only in local development. If you've deployed your app using Streamlit Cloud, the "Edit active theme" button will no longer be displayed in the "Settings" menu.
Tip
Another way to experiment with different theme colors is to turn on the "Run on save" option, edit your config.toml file, and watch as your app reruns with the new theme colors applied.
Caching
Important
We're developing new cache primitives that are easier to use and much faster than @st.cache. 🚀 To learn more, read Experimental cache primitives.
The Streamlit cache allows your app to execute quickly even when loading data from the web, manipulating large datasets, or performing expensive computations.
To use the cache, wrap functions with the
@st.cache decorator:
import streamlit as st

@st.cache  # 👈 This function will be cached
def my_slow_function(arg1, arg2):
    # Do something really slow in here!
    return the_output
When you mark a function with the @st.cache
decorator, it tells Streamlit that whenever the function is called it needs to
check a few things:
- The input parameters that you called the function with
- The value of any external variable used in the function
- The body of the function
- The body of any function used inside the cached function
If this is the first time Streamlit has seen these four components with these exact values and in this exact combination and order, it runs the function and stores the result in a local cache. Then, next time the cached function is called, if none of these components changed, Streamlit will skip executing the function altogether and, instead, return the output previously stored in the cache.
For more information about the Streamlit cache, its configuration parameters, and its limitations, see Caching.
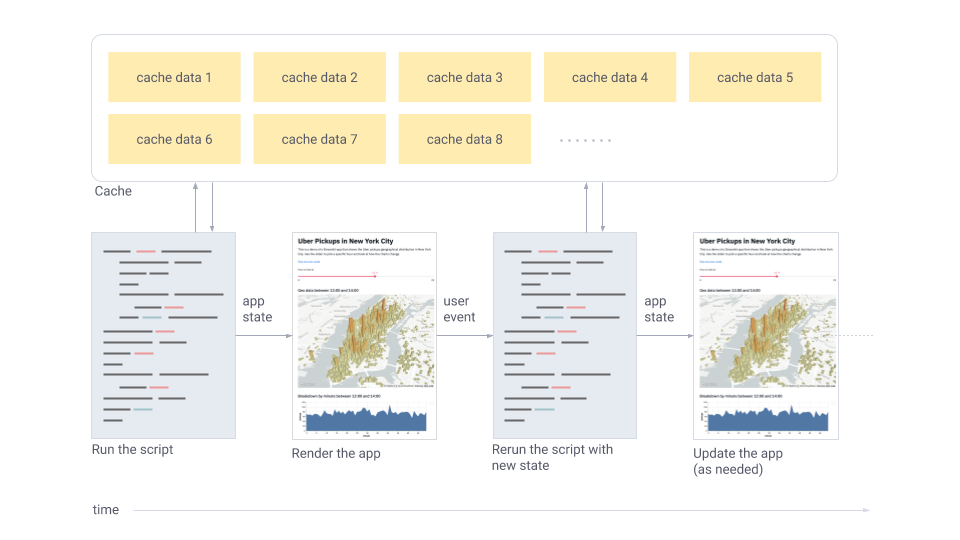
App model
Now that you know a little more about all the individual pieces, let's close the loop and review how it works together:
- Streamlit apps are Python scripts that run from top to bottom
- Every time a user opens a browser tab pointing to your app, the script is re-executed
- As the script executes, Streamlit draws its output live in a browser
- Scripts use the Streamlit cache to avoid recomputing expensive functions, so updates happen very fast
- Every time a user interacts with a widget, your script is re-executed and the output value of that widget is set to the new value during that run.